
 BY JOE ROJAS-BURKE | OB BLOGGER
 BY JOE ROJAS-BURKE | OB BLOGGER
Given Oregon’s green reputation, it’s jarring to see how badly the state ranks on measures of injustice in exposure to air pollution.
BY JOE ROJAS-BURKE | OB BLOGGER
 BY JOE ROJAS-BURKE | OB BLOGGER
Given Oregon’s green reputation, it’s jarring to see how badly the state ranks on measures of injustice in exposure to air pollution.
Environmental engineering professor Julian Marshall and colleagues at the University of Minnesota developed a high-resolution dataset on a major class of air pollutant – nitrogen oxides – and they used it to compare how neighborhood exposures differ according to the socioeconomic status and race or ethnicity of residents.
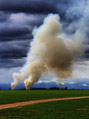
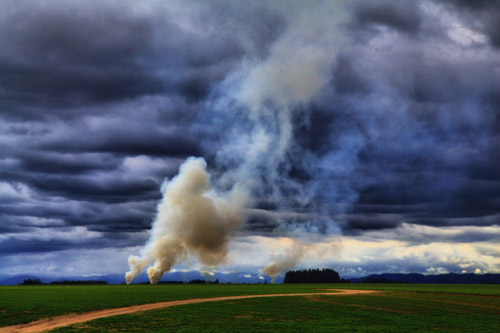
Much of the Willamette Valley scored as bad or worse than Southern California in the two measures of environmental injustice the researchers employed. The study didn’t delve into the local sources of nitrogen oxides, but exposure generally depends on how close you live to industrial sites, power plants, and heavily trafficked roads and highways. (About 5 percent of Hispanics and 5.4 percent of Asian or Pacific Islanders in the U.S. live within 150 meters of a major highway, compared with is 3.1 percent of non-Hispanic whites.)
Nitrogen oxides come from the exhaust pipes of cars, trucks and power plants and industries such as pulp mills that burn coal or natural gas. Living in places with higher levels of nitrogen oxides has been linked to increased risk of asthma, low birth-weight, and death from heart disease. Previous studies have found that concentrations tend to be higher in poorer neighborhoods. The new research is the first to map the differences in detail across the entire U.S. The study was published online in the journal PLoS One on April 15, 2014.
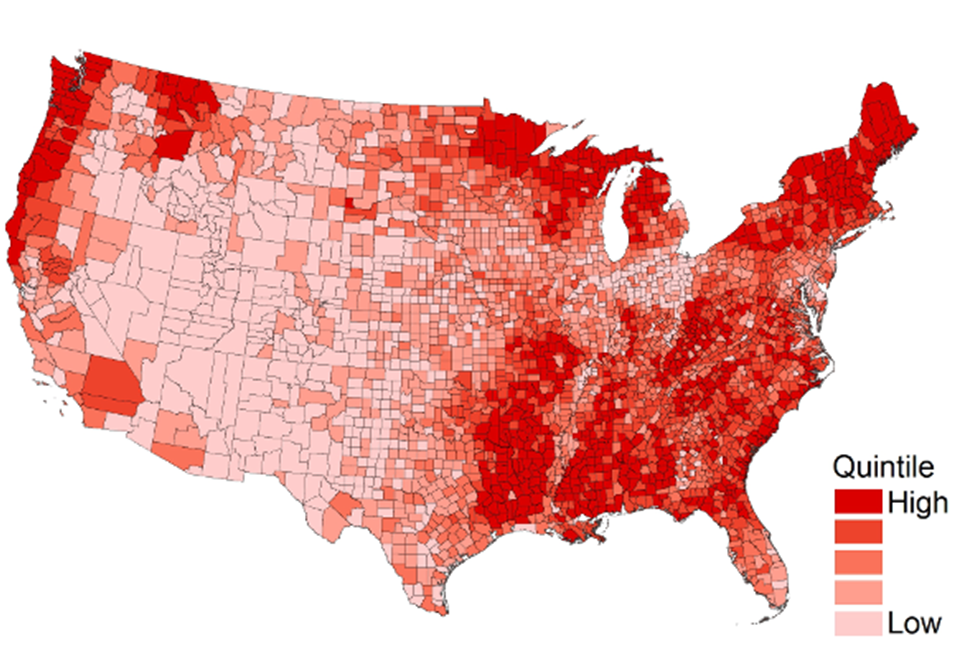
The map above compares exposure to nitrogen dioxide air pollution using the so-called Atkinson index of income inequality. It’s a way to measure how evenly or unevenly something is distributed across a population in relation to income. A score of zero would mean everyone is equally exposed regardless of income. Higher scores indicate worse inequality.
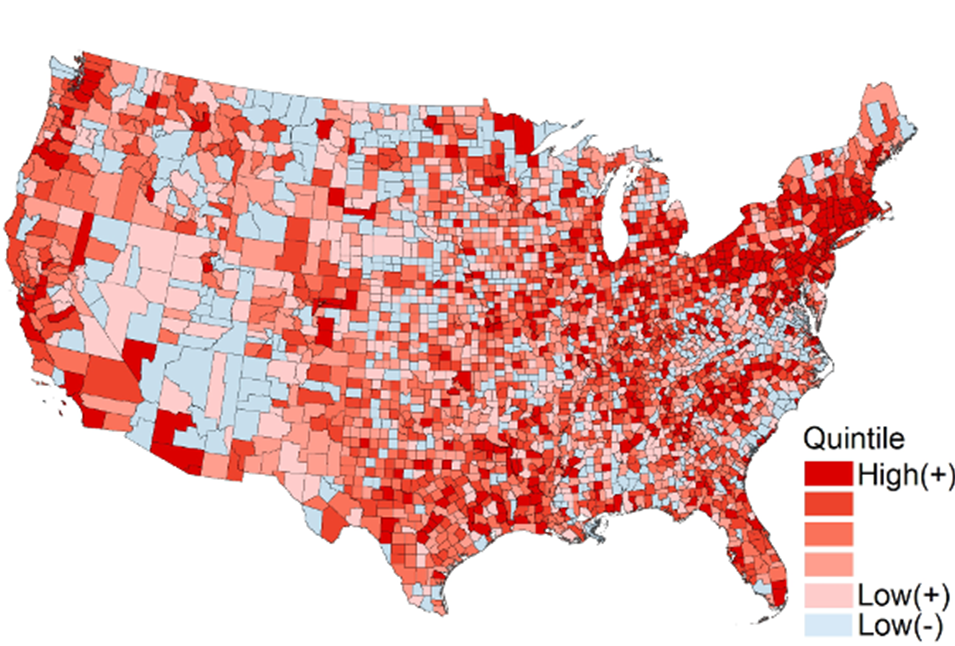
The map below highlights counties with the greatest inequality in exposure to nitrogen dioxide pollution by income and ethnicity. The comparison is between blacks, Hispanics and Asians earning less than $20,000 a year and whites earning more than $75,000.
The chart below shows how Portland compares with three California cities on exposure to nitrogen oxides (in parts per billion) by income and ethnicity:
Average | High income | Low income | Relative difference | |
Portland | 11.5 | 10.9 | 13 | 18% |
Los Angeles | 25.1 | 22.3 | 26.8 | 18% |
San Diego | 14.6 | 13.7 | 16 | 15% |
San Francisco | 16.4 | 15.8 | 17.6 | 11% |
Nationwide, the researchers concluded that residential exposures average about 38 percent higher for nonwhites than for whites, 10 percent higher for people below versus above the poverty line, and 8 percent higher for those with less than a high school education compared to those with a high school education or above.
These differences are far from trivial. The authors estimate that reducing nonwhites’ exposure to the average levels experienced by whites could prevent about 7,000 heart disease deaths per year. And that’s probably a lower-end estimate because it considers only one health outcome and one component of air pollution.
Possible solutions include doing more to cut motor vehicle emissions, for example, with cleaner fuels, very low emission engines, and better promotion of walking and public transportation. Some scientists think it’s time to impose much stricter standards for ambient concentrations of nitrogen oxides and other pollutants from cars and trucks.
Environmental justice advocates are calling for more vigilant city planning to prohibit new construction of apartments, schools, day care centers near highways. (A 2003 California law tried to prevent school districts from building campuses within 500 feet of a freeway, but at least one district, LA Unified, used loopholes to develop several new schools close to highways).
Injustices rooted in income inequality, and built over decades into the development patterns of cities aren’t going to be easy to reverse.
Joe Rojas-Burke blogs on science and health care for Oregon Business.
