
A report released yesterday shows greenhouse emissions are on the rise in Oregon — and that a huge chunk comes from people buying more stuff.
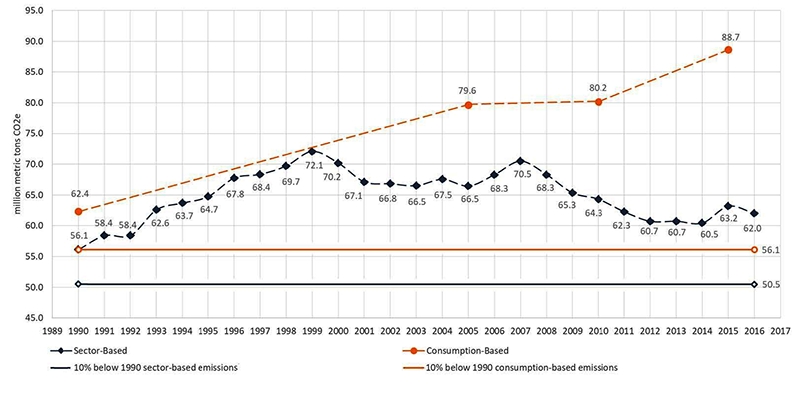
The Oregon Department of Environmental Quality uses two types of inventories to track greenhouse-gas emissions: a sector-based tally measuring emissions in Oregon from industry, and a newer, consumption-based inventory estimating emissions produced around the world due to Oregon consumption of products, services (e.g., food, airline travel, cars) and energy.
Creating two inventories provides a more complete picture of emissions activity, says Dave Allaway, a DEQ senior policy analyst and a co-author of a new report analyzing consumption and sector based emissions from 1990-2015.
According to this analysis, released yesterday, the trends are moving in the wrong direction.
Sector-based emissions are 10% above 1990 levels. Consumption-based emissions are 42% higher than 1990 levels.
The inventories reveal other patterns:
— Consumption-based emissions overall are higher than sector-based. The former accounted for 89 million metric tons in 2015, while sector-based emissions accounted for 63 million metric tons.
— Between 2005 and 2015, the state’s consumption-based emissions rose by 11%, in parallel with population growth. Overall, the amount of money Oregonians spent on products and services increased by 30% between 2005 and 2015.
 Case Study Coffee. An increase in Oregon imports, coffee included, is helping fuel an increase in consumption-based C02 emissions.
Sector-based emissions did show a temporary decline, from 66 million metric tons in 2005, to 63 million metric tons in 2015.
Experts caution that consumption-based emissions are not as well understood as sector based inventories. “There are no industry standards and protocols in place for this type of inventory,” says Kyle Diesner, climate action program coordinator for the city of Portland.
The lack of standards is one reason why consumption-based emissions are not used to benchmark Oregon climate policy.
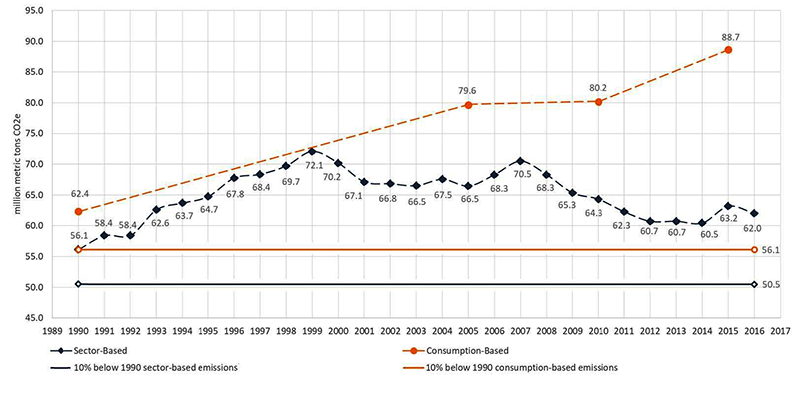
State law calls for a reduction of in-state emissions 10% below 1990 levels by 2020 and 75% below 1990 levels by 2050. But these targets are based on sector-based emissions, not the consumer tally.
Climate analysts will use the latest consumption-based emissions inventory to better understand how to develop policy that reduces emissions, Allaway said.
But the inventories raise a few uncomfortable questions, namely, whether Oregonians are willing to cut back on the amount of stuff they buy, and whether reducing emissions that are responsible for climate change is compatible with international trade and economic growth.
Read our related story, also published today, on rising aviation and maritime emissions.
Here are some other highlights from the report:
Transportation is Oregon’s largest in-state sector of emissions.
— Emissions from passenger vehicle use and freight transportation are increasing.
— The purchase and use of vehicles and parts is the largest category in the consumption-based inventory.
— Households are responsible for 80% of consumption-based emissions meaning individual choices and behaviors overwhelmingly influence global emissions.
— Oregon’s residential sector uses more electricity than any other sector.
— Lower-income households on average consume less and generate fewer emissions than higher-income households. Find the full report here.
A version of this article appears in the June 2018 issue of Oregon Business.