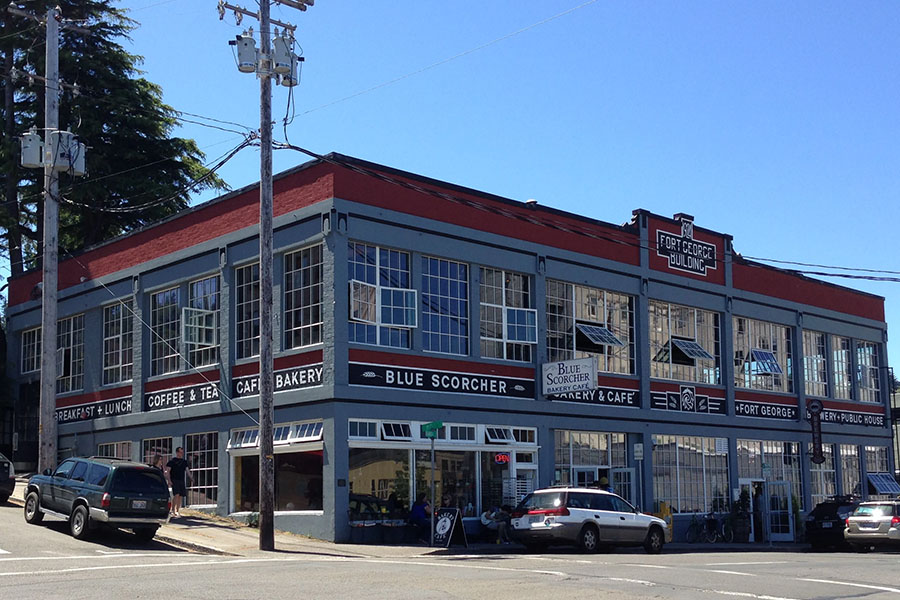
The funding will allow Astoria’s Fort George Brewery to install a rooftop solar array, among other projects.
A busy Klamath Falls dental office, a popular farm store in Gervais and a landmark Astoria craft brewery are among the recipients of $4.4 million in federal funding for rural green energy.
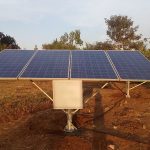
Most of the 20 projects selected by the U.S. Department of Agriculture are photovoltaic displays in communities outside the Portland metro area, according to a list circulated this week by the offices of Oregon’s U.S. senators, Ron Wyden and Jeff Merkley.
The two projects valued the highest are both worth $1 million. In Burns, Burns Solar will get a 100-megawatt ground-mounted solar PV system that will produce electricity to be sold to residents through the Oregon Community Solar Program. In Astoria, Fort George Brewery will install a 560-kilowatt PV system on its brewery roof. The array is expected to lower the brewer’s annual utility bill by $60,907.
The remaining projects are worth $561,000 or less. The smallest is $12,000 allotted to the Dirty Cowgirl Saloon in Wasco to replace its diesel furnace with an energy efficient heat pump. That upgrade is expected to reduce the saloon’s annual energy bill by $2,581 or 25%.
The grant money comes from the USDA’s Rural Energy for America Program which dates to 2008.
REAP provides grants and loans to agricultural producers and rural small businesses to purchase wind, solar and other green energy improvements. These upgrades are intended to help businesses strengthen operations, generate income and create jobs.

Any small business or ag producer may apply for REAP benefits so long as they have no outstanding delinquent federal taxes, judgments or tax debt.
REAP recipients have the hope of completely replacing their energy consumption with solar and saving thousands in energy costs, USDA’s Oregon state director, Margi Hoffmann, said in a statement.
“With these grants, farms can cut emissions and grow resiliency while continuing to invest in innovative new products and attracting the best people,” she wrote.
Wyden and Merkley trumpeted the awardees in a joint press release Monday.
“The investments will be used to help farmers, ranchers and rural small businesses adopt renewable energy technologies, conduct critical energy audits and cut costs and carbon pollution with energy efficient improvements,” according to the statement.
Wyden and Merkley last announced a slate of green-energy projects in September, with the 28 recipients of $2.3 million in funding from the federal Inflation Reduction Act.
The upside of a solar array is widely known: long-term savings and low-to-zero maintenance. But for many businesses, the upfront costs of a PV system are prohibitive.
The 2024 REAP recipients:
- $1 million for Spitfire LLC, aka Burns Solar in Burns, to purchase and install a 100-megawatt ground-mounted solar PV system.
- $1 million for Fort George Brewery Public House in Astoria to purchase and install a 560-kilowatt roof-mounted solar PV system.
- $561,165 for Bauman’s Farm and Garden LLC of Gervais to purchase and install a 590.7 kilowatt roof-mounted solar PV system.
- $449,250 for Bountiful Farms Nursery Inc. in Woodburn to purchase and install a 462-kilowatt roof-mounted solar PV system.
- $351,132 for Pratum Co-Op in Madras to purchase and install a 302.64-kilowatt roof-mounted solar PV system.
- $316,994 for Brooks Tree Farm in Salem to purchase and install a 297-kilowatt roof-mounted solar PV system.
- $99,496 for WHCC2A LLC in Newberg to purchase and install a 134.8-kilowatt roof-mounted solar PV system.
- $93,311 for Sidereus Winery in Cornelius to purchase and install a 66-kilowatt roof-mounted solar PV system.
- $86,219 for Fayworks LLC in Klamath Falls to purchase and install a 52-kilowatt roof-mounted solar PV system.
- $77,541 for Quandary Vineyards in Yamhill to purchase and install a 38.4-kilowatt ground-mounted solar PV system.
- $61,373 for Dorian Place in Ontario to purchase and install a 57.2-kilowatt roof-mounted solar PV system.
- $54,280 for Twin Springs Farm & Garden in Sandy to purchase and install a 44.62-kilowatt roof-mounted solar PV system.
- $52,643 for Dahle Orchards in The Dalles to purchase and install a 39.84-kilowatt roof-mounted solar PV system.
- $50,672 for Standing Tree Properties in Williams to purchase and install a 19.44-kilowatt ground-mounted solar PV system.
- $47,097 for Wellsprings Business in Ontario to purchase and install a 46.2-kilowatt roof-mounted solar array.
- $44,954 for Skyline Construction Services in Silverton to purchase and install a 42.7-kilowatt roof-mounted solar PV system.
- $36,541 for Timothy J. Moore, DDS in Klamath Falls to purchase and install a 21.3-kilowatt roof-mounted solar PV system.
- $34,500 for T&P Farms in Salem to purchase and install a 24-kilowatt roof-mounted solar PV system.
- $30,129 for A.M. Farm in Salem to purchase and install a 24.9-kilowatt roof-mounted solar PV system.
- $12,000 for the Dirty Cowgirl Saloon in Wasco to purchase and install an energy efficient heat pump.
Click here to subscribe to Oregon Business.