Negotiation agreement underway to bring major hotel, conference center and investment to downtown Portland.
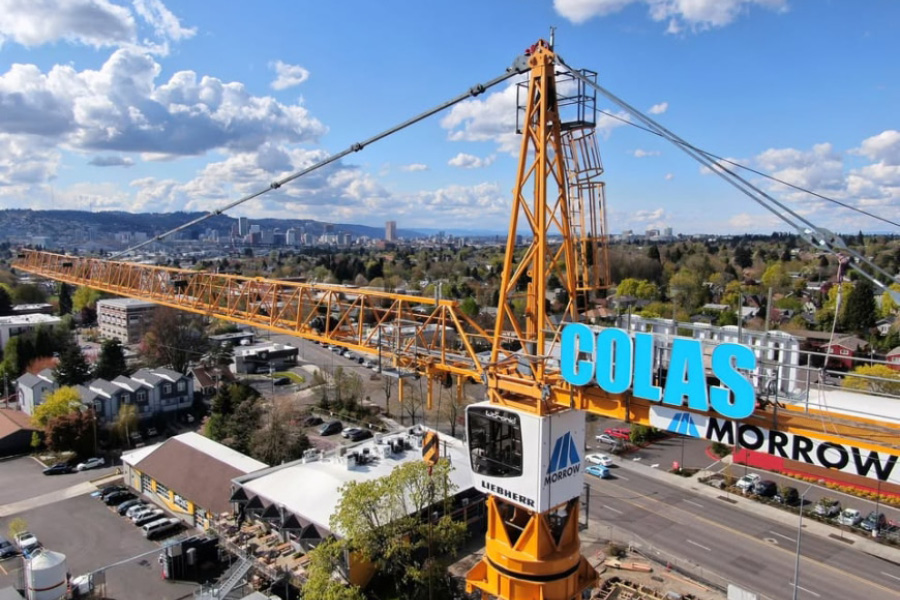
Portland State University has entered into an exclusive negotiating agreement with Colas Development Group to develop a 150-key hotel and conference center as part of the planned multi-use Performing Arts + Culture Center development at the south end of downtown Portland. PSU will serve as the overall developer of the complex. The agreement, which covers only the hotel and conference center, represents more than $70 million in private investment commitment to the heart of the city.
The Performing Arts + Culture Center is part of a broader vision that will help elevate Portland as a cultural destination, reignite investor confidence, activate south downtown, strengthen PSU’s signature performing arts program and energize the city’s arts ecosystem. The project’s proposed 3,000-seat Broadway-capable venue, to be owned by the city of Portland, and additional smaller PSU-owned academic and community-focused theaters will serve as a new cultural anchor for downtown. The on-site hotel and conference center will support that vision by housing visiting artists, performers, conference attendees and audiences.
“This is a multi-generational opportunity to shape the future of our campus and our city,” said Dr. Ann Cudd, president of Portland State University. “Selecting Colas Development Group to enter into an exclusive negotiating agreement for the hotel and conference center is a meaningful step and a signal that the Center is generating the kind of private investment opportunities that can serve as a catalyst, energizing downtown Portland long into the future. Portland State thrives only with a thriving city, and this milestone is proof that we are rising together.”
Colas Development Group brings together Colas Construction, Inc., one of the Pacific Northwest’s leading, family-owned construction firms, and HMS Developments, a real estate investment and development firm led by Ndamukong Suh. The group combines deep local expertise with national capital market relationships, positioning the team to help deliver a landmark hospitality project that reflects the scale, ambition and civic importance of the Center.
“We believe downtown Portland’s best days are still ahead. This is more than a development project. It is an opportunity to help shape the next chapter of our city,” said Andrew Colas, president and CEO of Colas Development Group and Colas Construction, Inc. “Together, Colas Development Group and HMS Developments are bringing locally headquartered leadership, private investment and a shared vision for Portland’s future. We are proud to partner with Portland State University on a project that will strengthen our arts community, support economic vitality and help reignite downtown Portland for generations to come.”
For PSU, the Center opens new curricular and workforce pathways in stagecraft, hospitality and the creative industries and brings national artists, internships and training programs to students and the city. At the same time, the entire region will benefit from a new hub for arts in downtown Portland, offering everything from the latest Broadway performances to accessible and flexible spaces for local and community arts organizations of all sizes. This district is designed to strengthen Portland’s creative ecosystem while contributing to downtown’s economic vitality.
The exclusive negotiating agreement will remain in place for at least six months during the initial stages of coordination, planning and development. The next step is dependent on the city of Portland and its elected officials providing confidence that the project will move forward. The performance venues themselves will be separately contracted and procured.
With an opening date in 2030, the Performing Arts + Culture Center will support the arts community, contribute to economic activity and expand access to performing arts across the region.
ABOUT THE PERFORMING ARTS + CULTURE CENTER
The Performing Arts + Culture Center is a public-private partnership reimagining Portland’s primary performing arts venue as a modern, community-focused cultural anchor in Portland’s downtown. The project brings together public leadership and private investment to strengthen access to the arts, support downtown vitality and ensure long-term public benefit for the next century. Learn more at paccpdx.org.
