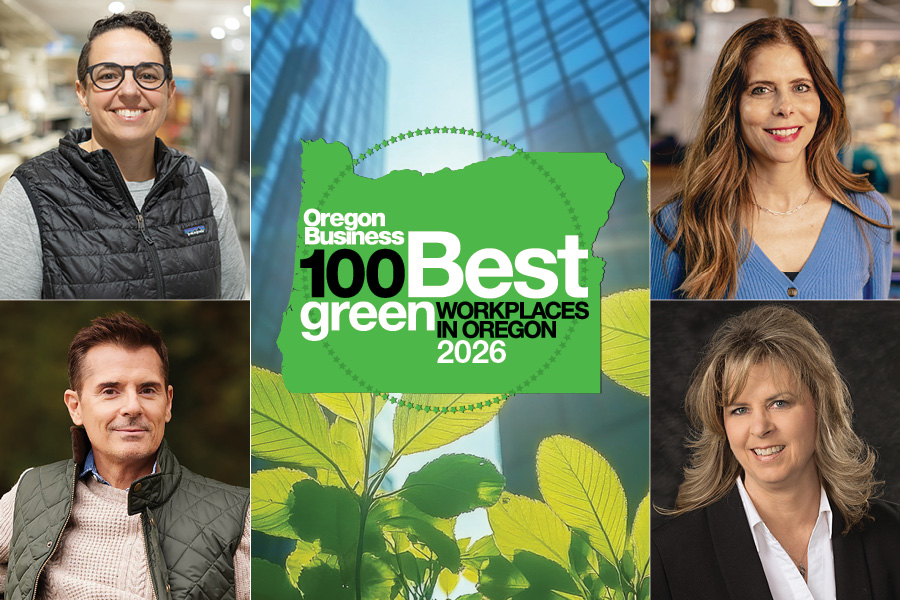
Four executives from this year’s 100 Best Green Workplaces in Oregon share how sustainability shapes company culture, operations, employee engagement and more.
Carly Colgan
CEO | Bend-Redmond Habitat for Humanity
Michael Jones
CEO/Founder | Hartmann&Forbes
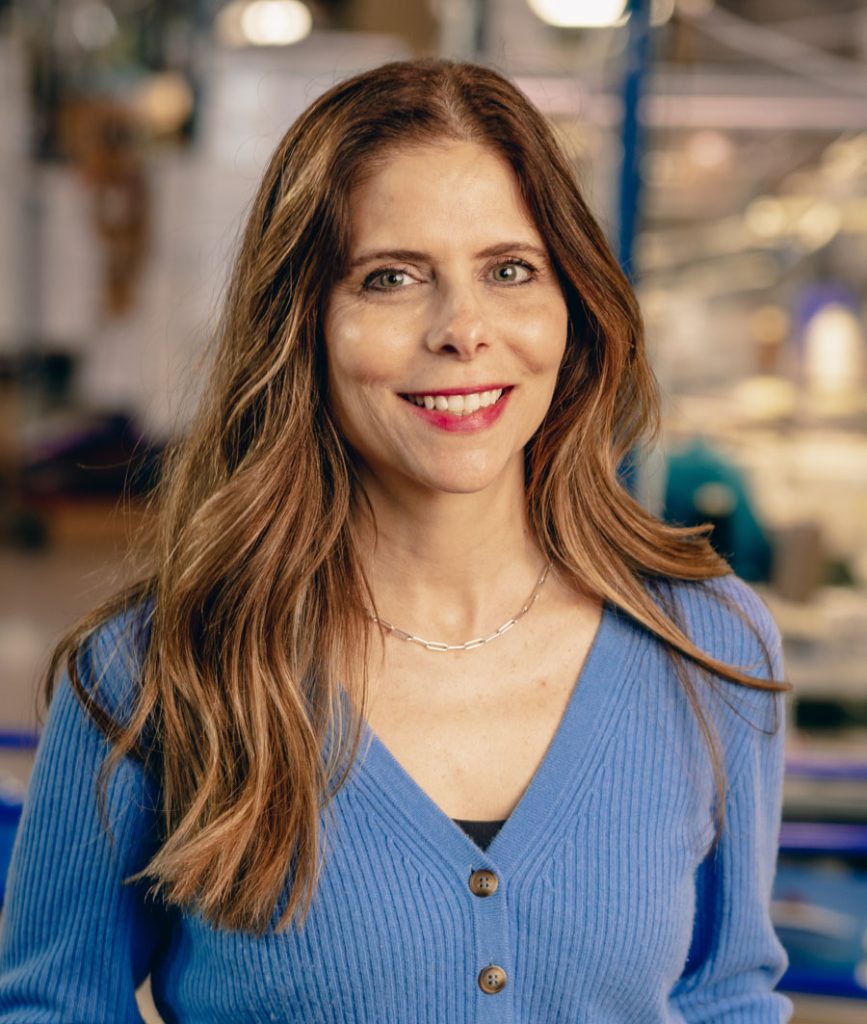
Sarah Vinicor Mason
Chief People Officer | Softstar Shoes

Lynn White
HR Manager | Epson Portland
How do you encourage employees at every level of the organization to participate in and take ownership of your sustainability efforts?
Carly Colgan: We encourage employees to participate in sustainability efforts by connecting sustainability directly to the purpose and day-to-day realities of each area of our work, rather than treating it as a separate organizational initiative.
In our retail operations, the ReStores, sustainability is closely tied to waste reduction, reuse and financial stewardship. Team members see firsthand how diverting materials from the landfill and maximizing donations not only benefits the environment but also strengthens revenue that supports our mission.
In construction, sustainability is tied to building high-quality, durable, energy-efficient homes that create long-term stability for homeowners. Staff take pride in knowing that sustainable building practices reduce utility costs, improve home performance and contribute to healthier living environments for families.
Within our administrative and support teams, sustainability is connected to operational efficiency, thoughtful resource use and long-term organizational health. This includes reducing paper use, improving digital systems, streamlining processes and making decisions that support both environmental responsibility and organizational sustainability over time.
Michael Jones: At Hartmann&Forbes, sustainability isn’t a department. It is part of the company’s culture and daily decision-making. Employees are encouraged to participate by feeling connected to the impact of their work, whether they are designing products, supporting clients, managing operations or handcrafting products. Through initiatives like Project Green, volunteer opportunities, internal education and company-wide sustainability goals, employees are empowered to contribute ideas and take meaningful action. Ownership comes from transparency and purpose. When people understand why sustainability matters — not only for the environment but for the health of our homes, communities,and future generations — they naturally become invested in helping move the mission forward.
Sarah Vinicor Mason: “Walking Lightly on the Earth” is one of Softstar’s core values, but it is not just about making sustainable leather shoes. We continuously evaluate our environmental initiatives and seek out new ideas for reducing our carbon footprint on every level. This includes not only the materials that go into our products but also the daily activities and processes used by our staff, the infrastructure of our building, our involvement with our community and many other seemingly small changes that add up to make a big impact.
Lynn White: Epson’s purpose — to enrich lives and create a better world through efficient, compact, and precise innovation — and our guiding principles outlined in the Epson Way create a strong foundation for employee engagement in sustainability efforts. Preserving the natural environment with future generations in mind is embedded into how we operate as a company and how employees approach their daily work.
We encourage employees at every level of the organization to participate in sustainability by fostering a culture of shared responsibility, continuous improvement and collaboration. Employees are encouraged to reflect on how their personal values align with Epson’s corporate purpose and environmental commitments, helping create a stronger sense of ownership and accountability. Sustainability is not viewed as a separate initiative but rather as an integral part of decision-making, operational practices, innovation and workplace culture across the organization.
What is one sustainability practice that had an unexpected impact on morale, operations or company culture?
Carly Colgan: A sustainability challenge that we ran across the organization had an unexpectedly strong impact on morale and culture. Each department was tasked with creating a new policy or practice that would contribute to sustainability within their area of work. Rather than simply submitting ideas, teams presented their concepts through skits during an all-staff meeting. What started as a sustainability initiative quickly became a culture-building experience.
The activity was educational, creative and genuinely fun. It gave employees an opportunity to think differently about sustainability and connect it directly to their daily work. It also highlighted the wide variety of ways sustainability can show up across departments, from operations and construction to administration and retail. The challenge increased engagement because staff felt ownership over the ideas instead of sustainability being something directed from leadership. It sparked cross-team conversations, generated practical improvements, and reinforced that sustainability is part of our organizational identity and culture, not just our construction practices.
Michael Jones: One practice that had a surprisingly powerful impact was creating more opportunities for employees to participate directly in environmental initiatives outside the workplace. Activities like tree planting, recycling drives, Solve Clean-ups and community partnerships strengthened connections between teams in a very organic way. What began as sustainability efforts evolved into culture-building experiences. Employees felt proud to work for a company whose values aligned with their own, and it reinforced the idea that environmental commitments are not just messaging. They are lived experiences that bring people together.
Sarah Vinicor Mason: We’ve always focused on sourcing materials domestically rather than overseas to decrease our environmental impact and ensure we have high-quality materials. During COVID we experienced far fewer supply-chain issues compared to the many companies that depended on international sourcing.
Lynn White: One sustainability practice that had an unexpected impact on company culture was the level of employee engagement and shared purpose that developed through our waste-reduction and community-recycling initiatives. What began as operational sustainability efforts evolved into opportunities for employees across the organization to actively contribute ideas, participate in programs and take ownership of environmental improvements.
Employees became highly engaged in identifying new recycling opportunities, reducing waste streams, and participating in collection drives throughout the year. Two notable initiatives — including partnering to repurpose plastics into NexTrex® products and hosting Metro Hazardous Household Waste Collection Events to support the local community — were entirely employee-driven. These efforts strengthened collaboration across departments, increased morale and reinforced a culture where employees feel empowered to make a meaningful impact both within the company and in the community.
What has been the biggest challenge in building a culture of sustainability at your company, and how have you worked to overcome it?
Carly Colgan: One of the biggest challenges in building a culture of sustainability has been that sustainable practices often require more effort, education and intentionality at first. Changing habits and helping people understand the long-term impact can take time. We have worked to overcome this through education, connecting sustainability to our mission, and giving teams ownership in developing ideas and solutions. Over time, it has become less about policy and more about culture.
Michael Jones: One of the biggest challenges is ensuring sustainability remains a long-term commitment rather than a short-term initiative. It requires consistency, education and a willingness to continually evolve. As expectations and technologies change, it is important to stay committed without losing sight of core values. That challenge has been addressed by embedding sustainability into the foundation of the company rather than treating it as an add-on. From sourcing renewable natural materials to reducing waste and investing in responsible manufacturing practices, decisions are guided by a clear philosophy: Create beautiful handcrafted products with the least possible impact on the environment.
Sarah Vinicor Mason: We are challenged daily to make sustainable choices while keeping Softstar financially healthy. We could cut costs by using cheaper leather, glue and shipping materials, but it would sacrifice the quality of our shoes and the health of our employees, customers and the earth. We can’t do it all, so at times we might offer fewer, higher-quality options. By becoming more efficient in our production process, we can decrease waste and afford materials that are more sustainable and of higher quality.
Lynn White: One of the biggest challenges in building a culture of sustainability has been sustaining progress after many internal improvements were already in place. As our Hillsboro site works toward its zero-waste-to-landfill (ZWTL) commitment, finding alternative uses for remaining waste streams has become increasingly complex. A major challenge came with the closure of the Brooks/Gervais waste-to-energy facility in late 2024, which required nearly a year to identify a sustainable alternative. Throughout the process, our shared purpose and values helped maintain focus and commitment to our environmental goals.
How do you ensure your sustainability commitments remain authentic and measurable rather than aspirational?
Carly Colgan: By embedding sustainability into our organizational culture and decision-making, rather than treating it as a separate initiative. Sustainability is one of our core values, and we keep it front and center in everything we do, from construction practices and operations to strategic planning and team conversations. We also focus on tangible actions and measurable outcomes, whether that is building net-zero homes, reducing waste, improving operational efficiency or creating department-level sustainability practices. Keeping sustainability connected to daily work helps ensure it remains actionable, accountable and mission-driven rather than just aspirational.
Michael Jones: Authenticity comes from accountability. Sustainability should be measurable, transparent, and reflected in real operational practices, not just marketing language. Materials, manufacturing processes, and environmental impact are continually evaluated to ensure actions align with company values. Sustainability has guided Hartmann&Forbes since the beginning, long before it became an industry trend. Because it is part of our identity and decision-making process, it remains something we actively practice every day rather than something we simply aspire to.
Sarah Vinicor Mason: As an Employee-Owned Trust, we have a lot of people keeping us honest! Many of our employees have a deep passion for sustainability and aren’t afraid to speak up when they see something that doesn’t feel authentic. This creates enthusiastic discussions that require not just education about sustainability but also financial transparency around the realities of business.
Lynn White: Authenticity comes from accountability. Our Environmental Management System has maintained ISO 14001 certification for decades, and we publicly share sustainability goals, metrics and progress through annual reporting. Epson also sets measurable, time-bound commitments. In 2021 Epson announced its goal to become carbon negative by 2050 and committed to transitioning to 100% renewable electricity at all global sites. By December 2023 — just 2 years and 10 months later — that transition was completed, eliminating approximately 400,000 tons of greenhouse gas emissions.
What role does leadership play in setting the tone for environmental responsibility at your company?
Carly Colgan: Leadership plays a critical role in setting the tone for environmental responsibility because it has to be modeled consistently, not just talked about. I believe employees need to see leadership making sustainable choices, prioritizing sustainability in decisions and holding it as a real organizational value.
Michael Jones: Leadership sets the standard by demonstrating that environmental responsibility is a business priority, not a secondary initiative. People look to leadership for consistency, action and clarity of purpose. When leadership is genuinely committed, that mindset naturally becomes part of the company culture. It is important for leaders to communicate the “why” behind decisions and lead by example. Sustainability influences how materials are sourced, how products are designed, how facilities operate and how communities are supported. When employees see those values consistently reflected in leadership decisions, it builds trust and shared commitment throughout the organization.
Sarah Vinicor Mason: Softstar is a B Corp [a company certified to meet high standards for social and environmental performance, transparency and accountability]. We are committed to responsible business practices that benefit both people and the planet. We have a “B Keeper,” who is an employee with the specific responsibility to help us maintain high standards of accountability and purpose.
Lynn White: Leadership plays a critical role in setting the tone for environmental responsibility at Epson. Through the Epson Way, leadership ensures employees across the organization are aligned around a shared purpose and common values that support both operational and sustainability goals.That commitment is demonstrated through investments in renewable energy, energy conservation, water-efficiency improvements, recycling partnerships, and programs that encourage employee participation in environmental efforts both inside and outside the workplace.
What advice would you give to other leaders who want to build a greener workplace but aren’t sure where to start?
Carly Colgan: Start small and build from there. Sustainability does not have to begin with large-scale changes or major investments. Small, practical actions can create meaningful impact over time and help build momentum across an organization. The most important thing is to start somewhere, involve employees in the process and stay consistent. Every little bit helps, and small efforts often lead to bigger cultural and operational changes over time.
Michael Jones: Start with intention and authenticity. There is no need to solve everything at once. Meaningful sustainability efforts begin with small, consistent decisions that align with company values and long-term vision. Focus first on areas where a genuine impact can be made, whether that is reducing waste, improving sourcing practices, supporting employee engagement or investing in healthier environments. Most importantly, approach sustainability as a long-term responsibility rather than a marketing initiative. Employees and customers can recognize the difference, and authenticity is what creates lasting change.
Sarah Vinicor Mason: Start with just a few small initiatives so you don’t get overwhelmed. One of the best, simplest places to begin is to buy less. Focus on sustainable decisions that also save money; if you can share those savings with your employees, you can encourage buy-in. Adopt a mindset of progress over perfection. Remember you will never “win” at sustainability. The work is never done, and that’s OK. It should be a constant consideration that helps guide decisions over time.
Lynn White: Start with actions that are measurable, achievable and visible to employees. Building a sustainability culture takes consistency, engagement, and leadership support — not a single large initiative. Involve employees early, and focus on understanding your organization’s environmental impacts and identifying practical opportunities to reduce waste, conserve energy and improve efficiency. Often the best sustainability ideas come from the people closest to the work. When employees see leadership listening, supporting innovation and remaining committed to sustainability, it becomes part of the company culture rather than just a corporate message.