 BY ERIC FRUTS | OB BLOGGER
 BY ERIC FRUTS | OB BLOGGER
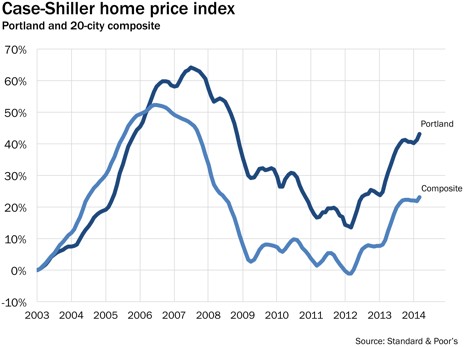
Last year, the housing market in Oregon—and the U.S. as a whole—was blasting off. The Case-Shiller index of home prices ended the year 13% higher than at the beginning of the year. But, was last year a blip, or a trend?
 BY ERIC FRUITS | OB BLOGGER
Is it a blip, or a trend?
That is the toughest question that economists have to answer when trying to forecast where the economy is going.
Last year, the housing market in Oregon—and the U.S. as a whole—was blasting off. The Case-Shiller index of home prices ended the year 13 percent higher than at the beginning of the year. A homebuyer who paid $250,000, would have added almost $33,000 in equity over the course of the year. According to past observation, that additional wealth (on paper, at least) would ultimately translate into increased consumer spending which would, in turn, boost the economy.
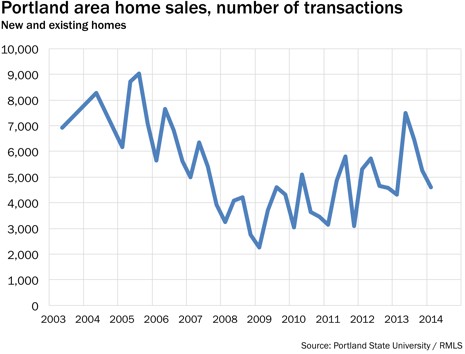
More detail on the Portland market shows that last year saw a number of home sales that had not been seen the days of the housing boom of the mid 2000s. Last year, 23,500 home sales were recorded, which is about the same value as the last half of 2006 and the first half of 2007.
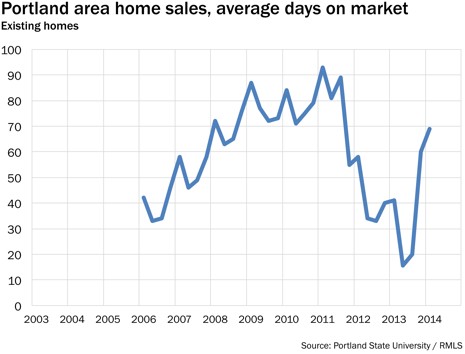
Even more striking, 2013 saw the average house selling in less than 30 days after it hit the market. It seems that sellers could plant a “For Sale” in the morning and get a phone call with an offer before they went to bed that night.
But, was last year a blip or a trend?
This year, housing has seems to have slowed. The number of transactions seems to have flattened out and the number of days on the market about doubled since last year. Prices do no seem to have the double-digit growth seen a year ago.
Is the current slow down a blip or a trend? Is the market tapping the brakes, or slamming them?
The tough winter elsewhere stalled out housing starts in the first part of the year. That’s a blip. But other things point to potentially troubling trends.
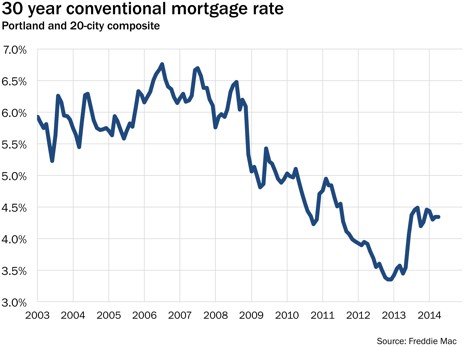
In the second half of last year, mortgage interest rates began to rise, largely because of expectations that the Fed’s bond-buying program, known as quantitative easing, or QE, was coming to an end. And, it does have to end. But, we don’t know when and we don’t know how. Nevertheless, mortgage interest rate are a little less than one percentage point higher this year than they were the same time last year. For a $200,000 mortgage loan, the payment this year is about $100 more per month than for a loan obtained last year.
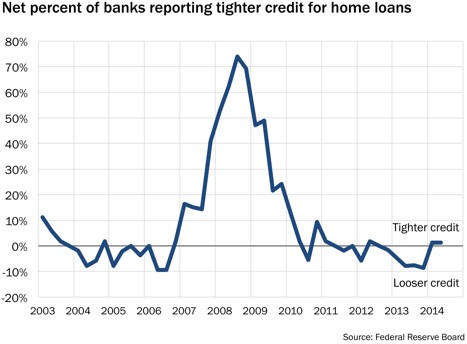
In addition to rising interest rates, mortgage lending remains somewhat tight. Last year lenders reported loosening lending standards for much of the year. This year has seen a slight tightening of lending. (Or, more precisely, lending is not getting looser.) The combination of higher interest and tighter credit has tapped the brakes on the housing market.
We know that mortgage interest rates will rise, but we don’t know when or by how much. Credit standards will likely remain tight so long has employment and income opportunities remain stagnant or sluggish. Without a boost to employment opportunities and a renewed interest in returning to work, housing and much of the rest of the economy will remain blipping along a series of small ups and downs.
Eric Fruits, Ph.D. is president and chief economist at Economics International Corp. and an adjunct professor at Portland State University.
