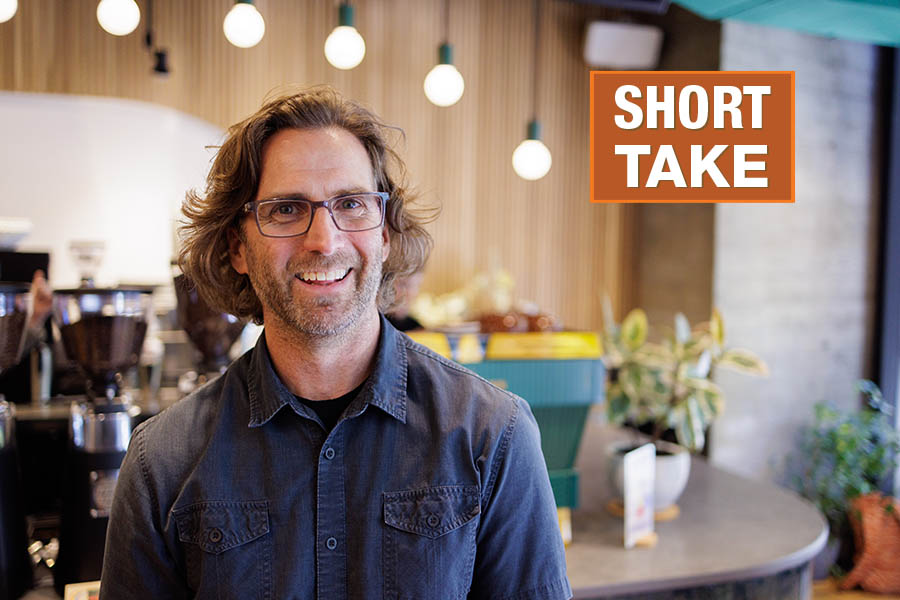
Stumptown VP Jon Perry talks about the chain’s new West End digs, how climate change is affecting producers — and what roasts are best enjoyed in the air
In the newest Stumptown Coffee Roasters cafe on SW Washington, you’d be forgiven for thinking you’d been transported to a Portland that never heard the word COVID-19.
Pulsing dance music. Calm, casual Japanese-Scandinavian design. Smiling faces.
Founded in 1999, Stumptown quickly distinguished itself as the cream of Portland’s high-end roasters, powered in part by a line of innovative cold-brew offerings introduced in 2011, often sold in a distinctive stubby brown bottle. The emerging roaster-retailer alarmed cafephiles in 2015 when it sold to specialty grade pioneer Peet’s Coffee, though both parties professed the deal allowed Stumptown independence along with the capital to grow.
The company had mixed success during the pandemic. Grocery and, especially, e-commerce sales soared for Stumptown, but the company also closed nearly half its brick-and-mortar locations. Today, around 50 of its 220 employees work at its eight cafes (nine if you count the Stumptown location in a Warner building in Los Angeles that’s closed to the public). Cafes remain important symbolically to Stumptown while bringing in around one-eighth of its revenue, according to Stumptown VP of coffee shops Jon Perry.
Stumptown’s latest joint opened last week in an annex of the 24-story Eleven West tower, a project of Greg Goodman and family. It’s technically not a new Stumptown café, but one relocated from the Ace Hotel two blocks away. That said, everything about it — aside from the employees — seems brand new, from the point-of-sale device to the custom art on the bathroom walls.
While regular customers adjusted to new digs at a soft opening last week, Perry talked coffee shop design, honoring the Capax Infiniti mural next door and which roast tastes best at 30,000 feet.
This interview has been edited for length and clarity.
First of all, how do you like your coffee?
I drink black drip coffee. Usually single origin. And that rotates.
Your new location is in downtown’s West End, a part of Portland that feels a little different than it did a few years ago. Why is Stumptown bullish on downtown?
We believe it’s coming back, and we want to be on the forefront of helping it come back. We’ve been meeting with folks who are excited about this area, and they’re putting their own money down. The Goodman family is a good example … What they did here, with this building, is an encouraging, inspiring project to be a part of.
But we stayed — we stayed in the Ace the whole time. A lot of companies pulled out of downtown but we kept both (downtown locations) open. We’re still excited about it.
A third of downtown office space is vacant. Whole buildings are empty. Are office workers ever coming back or will businesses have to get more creative to lure people downtown?
I have a theory — and it might just be my own personal theory — but I think people are starting to recognize the need for community in their lives and are choosing to come back. We’re seeing that in our own company, and it’s happening in other companies that I’m hearing of; people are voluntarily coming in for a few days a week. I think they recognize that being home by yourself all day maybe isn’t the best thing for your mental health. So we’re starting to spend more time together.
The Portland brand has taken a bit of a hit lately. How has that affected Stumptown, tied as it is to Portland?
We operate cafes in New York and L.A. and it really doesn’t come up, the challenges we’ve had here. It’s impacted us just because business has been so slow on the west side with people leaving and not coming downtown as much. But not with our brand. I don’t think people make that connection.
Our founder had a real strong connection to Portland and that continues today with our leadership. And I’d say today, it’s as strong as ever. It’s funny, in New York and L.A., people don’t know that Portland has this kind of derogatory nickname of Stumptown. I always wonder, what do they think “Stumptown” is? … We’ve been in New York, roasting, now for 14 years. We have people in New York who have a real strong connection to Stumptown, and it’s a local roaster to them. They think “Stumptown” and just think we’re from New York.
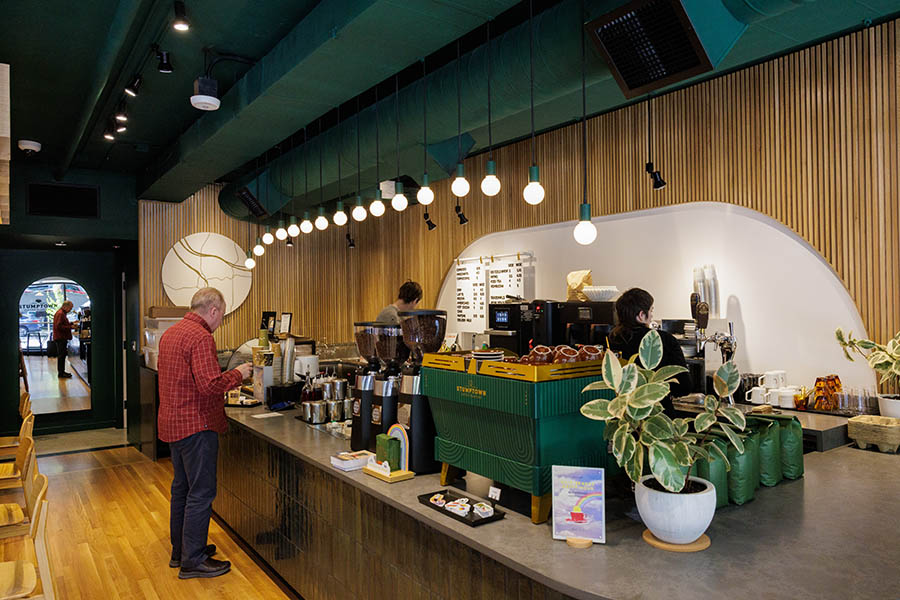
What makes a good coffee shop?
To us, it starts right there [points to counter] with baristas. Coffee shops, historically, have been a community space where people come together and talk about ideas and share with each other. So it starts with our baristas and their connection with the community they’re serving.
From there, you have to have a really dialed-in coffee program. What you see over there is a single-origin espresso, a really amazing blend, our Hair Bender coffee. Trapper Creek for the decaf. And then all of our equipment is just really dialed-in to specs that amplify the coffee.
What about this shop — are there features that are unique?
So every cafe we build is from scratch, so there’s no other Stumptown cafe like this. There are a few things that they all have in common. There’s the gold leaf signage on the windows, even though it’s a different logo in each location. There’s also an espresso machine unique to each space. That one [points] was custom-created for this location. The menus are also always similar.
Outside of that, our challenge always is, How do we create a Stumptown that feels essentially like a Stumptown but looks nothing like the other ones? And I think we do a really good job.
It should take several visits to one of our cafes to get it all. With some coffee shops I’ve been to, you get it all right when you walk in the door. But I want people to have to come here like four or five times and still see [points to an image painted on the wall near the ground] these tiny people drinking coffee right here.
Does the design of this shop cater to remote workers?
We built this one knowing full well this place was going to be popular with office workers.
There are 12 outlets on the floor. There’s space outside meant to have meetings. We have six of what we call “laptop seats” where you can be by yourself, take calls, whatever, look out the window.
How do you hire good baristas?
We’re really blessed in that we are a place where people really want to work.
A lot of the time, a person might work at a different coffee shop that uses Stumptown coffee and went through training on that coffee. And then when they’re looking for something, they seek us out because they want to work on what they learned. So we attract a really amazing pool of high-level baristas, who also, by the way, are artists, photographers, musicians. It’s this really creative, eclectic group that comes to find us.
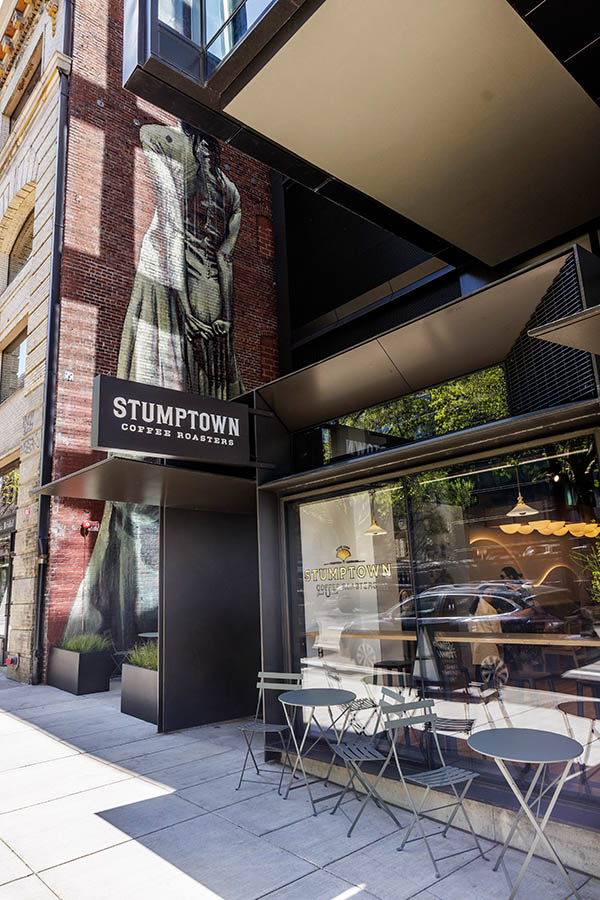
Was there an effort to feature the Capax Infiniti mural next door?
That is my favorite mural in Portland. So when they started developing this lot, I thought, “Oh no, don’t cover it up.” I think a a lot of people did.
We were actively looking to relocate the cafe from the Ace, and this location kept being floated as a possibility, so I decided to go meet with the Goodmans and see what their vision was. And it was eye-opening in terms of their desire to retain that mural. It was a big part of that project. You know, they lost a lot of square footage not covering it up.
And, part of our ethos is: Everything we do should feel like art. No matter what it is. Except for creative accounting — that’s never a good thing. But literally integrating art, in the form of a mural, into our space here, to me felt like, so kismet.
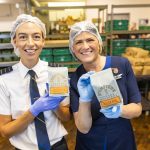
I know Stumptown takes its sourcing seriously and I suspect that’s why bags of Stumptown cost more than other brands at the grocery store. Is it challenging to have to always explain that to customers?
I think it’s becoming more known by customers, why things cost the way they do. We are always trying to do a better job of articulating it because we take it for granted — we’ve done this from the beginning. We have farmers we’ve bought from for 21 years.
So we know that story. But being able to amplify that story and communicate it across the counter is our biggest challenge. It’s a lot of information, and how do we communicate it without overwhelming people with signage?
So we spend a lot of time internally talking about it. For every coffee that we sell, every barista goes through a training on like, what it is, who the farmer is, how long we’ve partnered with them, flavor notes. Then they have that information to share, because there’s no better person to do that than your barista.
How has climate change affected Stumptown’s producers?
Yeah it’s affecting them and they’re telling us about it. I went to Costa Rica about three months ago and hung out with one of the farmers and he said it’s changing the weather patterns and it’s become really obvious. Parts that were unproductive before are becoming productive. They were too hot or they didn’t have the right cloud cover to grow coffee, and now they’re the right climate that you need. But areas down lower are not able to be as productive because they’re just too hot. They don’t get frost from the cool air of the night anymore.
So because of that, they’re having to dramatically change. They’re having to look at varietals and see what performs better with a warming climate. But folks along the equator, where coffee is grown, they’re the ones impacted before anyone else. And it’s changing their yields.
Stumptown recently became the in-flight coffee of Alaska Airlines. Does coffee taste different on an airplane?
I think they ended up testing 100 variations to get it really dialed in. Because, when you’re at elevation, your palette responds differently. There’s the dry air. The jet fuel.
We actually started out with a totally different coffee for that. We were looking at doing a medium-to-light roast. But then, when we got up there, we realized, oh, it gets washed out. So we went to a darker roast. And that allowed you to taste it.
It took a long time. In fact, our folks flew with Alaska several times and did tastings with the passengers, literally going down the aisle and getting feedback from them. And we took that information and came back, tweaked it and then launched it. It was actually a really long process.
It’s its own Alaska blend. It’s slightly darker. Latin American. It’s great. On the ground, if you go to our lounges at PDX, it’s Holler Mountain, Hair Bender as espresso and Trapper Creek. But those didn’t work in the air.
Click here to subscribe to Oregon Business.